Data Architecture
AI for Decision Makers | LAM Research
July 18, 2026
0. Meet Your Instructors
Jed Rembold, Ph.D.

Clinical Associate Professor of Computer Science
Willamette University
jjrembold@willamette.edu
Astrophysicist, now happily in the data.
Background & Research
Trained as an astrophysicist. Ph.D. dissertation on near-Earth meteoroids, measured through lunar impact observations. Part of the Magdalena Ridge 2.4m telescope team before moving fully into computer and data science.
Teaching
Introductory programming, database management and storage, and Advanced Data Engineering. Works at the junction of the natural sciences and computing.
Education
Ph.D. Astrophysics, New Mexico Tech. B.S. Physics and Math, Linfield College.
Lucas P. Cordova, Ph.D.

Associate Professor
Willamette University
lpcordova@willamette.edu
From building software to building software engineers.
Background & Research
Software engineer and team leader turned professor, developing the engineers I’d want on my team and studying what happens when AI becomes part of how we build, learn, and work.
Teaching
Teaching students to write great code, tame messy data, and solve hard problems.
Education
Ph.D. Software Engineering, M.S. Software Development & Management, B.S. Computer Science
Industry Experience
Hewlett-Packard, Elemental Technologies, SAIF Corporation
1. Pitfalls, Failures, and Governance
Learning Objectives
What You’ll Leave With
By the end of this segment, you will be able to:
- Name where a data stack breaks, using a concrete symptom instead of “the data is a mess.”
- Explain single source of truth, and point to one place yours is violated.
- Define data lineage and say why it is the first thing to ask for when a number looks wrong.
- Ask three questions of any team whose data your decisions depend on.
Part 1: The Monday Morning Disagreement
Two numbers. One company. Somebody is about to present the wrong one.
Yesterday You Were Michael Scott
You took Michael’s job at the Scranton branch.
You had three tasks:
- Decide which reps deserve a raise.
- Forecast next quarter’s sales by product.
- Find the customer segments worth advertising to.
Every one of those starts with a number you trust. This morning is about what happens when you cannot.
Same Question, Two Answers
Michael needs one number for the board deck: what did Scranton sell?
The hand-kept tracker
The sheet Michael’s team actually maintains. 155 rows, updated by hand, lives on somebody’s desktop.
The system of record
sales_order_lines, the same file you opened in Excel yesterday. Built from orders that shipped and were invoiced.
Total: $43,020.24
Total: a different number.
Both are “the data.” Both are defended by someone with a job title. Which one goes in the board deck?
Look at the Actual Sheet
Five real rows from regional_manager_tracker.csv:
| Date | Client | Rep | Qty | Total $ | Notes |
|---|---|---|---|---|---|
| 01/05/22 | Whitmore Nonprofit Services | 83 | 19 | 249.36 | check w/ Dwight |
| 09/02/22 | Ridgeline Nonprofit Services | 5 | 23 | 365.24 | net-30 |
| 07/07/22 | Cascade Nonprofit Inc | 5 | ~11 |
107.03 | net-30 |
| 06/28/22 | Redwood Financial Goup | 104 | ~8 |
136.40 | net-30 |
| 02/10/22 | Conerstone Retail Associates | 161 | 15 | 230.01 |
Spot the Pitfalls
Nothing here is malicious. Every one of these is a person doing their best on a Tuesday.
Open regional_manager_tracker.csv.
Take 60 seconds. What is wrong with that sheet? Call them out.
The Pitfalls
Here is what is actually in there:
~11anda dozenin a column that should be a number. 23 of 155 rows, 14.8%.Goup,Conerstone,Summi. Client names that will never match your CRM.01/05/22. Two-digit year. January 5th or May 1st?Repis83. An ID, with no name attached.- No order number anywhere. You cannot match this back to anything.
- And about 2 in 5 of those totals are simply wrong.
Part 2: Where It Breaks
Six pitfalls. You have met all of them.
This Is What Messy Looks Like
Yesterday, Prof. Kitada Smalley gave you tidy data: one variable per column, one observation per row, one value per cell. She also showed you the messy versions.
That sheet is the messy version, in the wild, feeding a board deck.
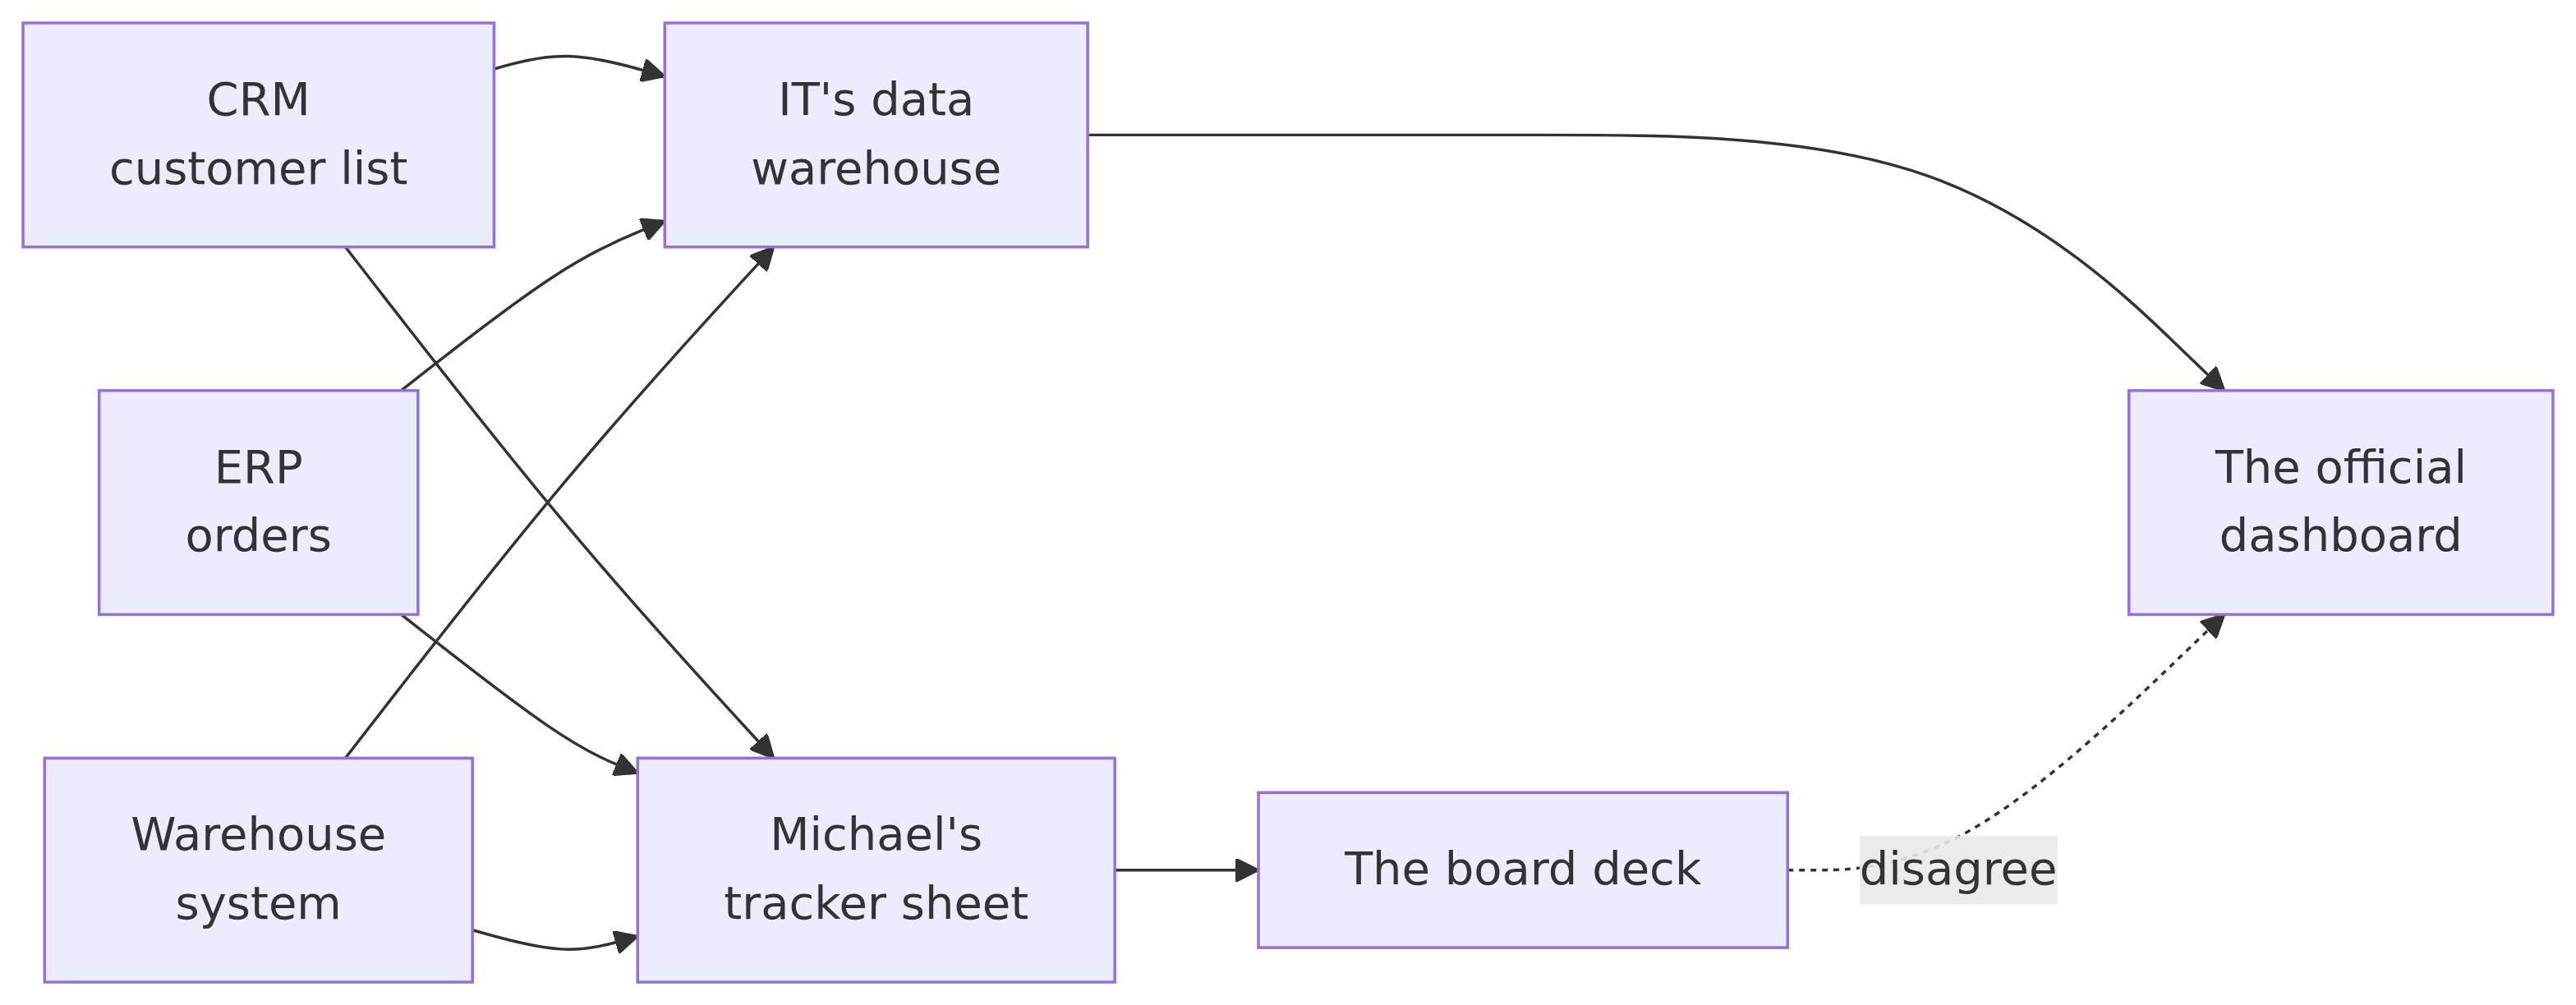
The Stack Underneath
Two paths out of the same three systems. They do not agree, and the disagreement is the deliverable that lands on your desk.
Pitfall 1: No Single Source of Truth
When the same question has two owners, it has two answers.
The tracker says $43,020.24. The system says something else. Neither is labeled “official.”
Single Source of Truth (SSOT) means: for any given number, exactly one system is authoritative, and everyone knows which.
You almost certainly do not have this. That is normal. Knowing where you do not have it is the actual skill.
Pitfall 2: Key Drift
To combine two systems you need a shared key. In practice, the key is missing or mangled.
In the Dunder Mifflin CRM export, of 1,923 rows:
- 97 rows (5.0%) have no
Acct IDat all. - The rest match to the customer list perfectly.
So 5% of your customers silently vanish from any report built on that match. No error. No warning. The total is just quietly too low.
Pitfall 3: Format Chaos
The same fact, written five ways, is five facts as far as a computer is concerned.
| What it should be | What it actually is |
|---|---|
| A number | $141.58 (text, with a dollar sign) |
| A date | 10/13/2022 here, 01/05/22 there, ISO somewhere else |
| A quantity | ~11, a dozen |
| A phone number | (682) 486-2143, 2953356785, 209.577.2260 |
| A status | FULFILLED vs Fulfilled |
Every one of these is a real value in the Dunder Mifflin exports. Sorting that AMT column puts $99 after $1,000.
Pitfall 4: Duplicates
Nobody sets out to double-count. It happens on export.
- CRM export: 61 exactly duplicated rows.
- ERP export: 93 exactly duplicated rows.
If you sum revenue off the raw ERP export, you have just billed 93 orders twice. Your number is too high, and it is too high in a way that looks completely reasonable.
Pitfall 5: No Lineage
Data lineage is the map of a number’s entire journey, from the system it was born in to the cell you are looking at.
Ask of any number on any dashboard:
- Which system did this originate in?
- What was done to it on the way here?
- Who changed that, and when?
If nobody can answer in under a day, you do not have lineage. You have folklore.
Pitfall 6: Bus Factor
The tracker lives on one laptop. One person knows the cleanup steps. Those steps live in their head.
Bus factor of one. If they take a vacation, the report is late. If they leave, the report is gone, and so is any hope of explaining last quarter’s numbers.
Manual steps are not just slow. They are undocumented by construction.
🧠 Quick Quiz: Lineage
A regional revenue number on your dashboard looks 30% too high. What does asking for data lineage actually get you?
A. A backup of the old spreadsheet versions so you can recover the previous number.
B. The map of that number's journey from its origin system to the report.
C. The folder structure on the shared drive where the team's files live.
D. A list of which fields are numbers and which are text.
B. Lineage is the journey, not the storage. It is what lets you walk backward from the wrong number to the step that broke it, which in this case is probably those 93 duplicated ERP rows. A, C, and D are all real things. None of them tell you where a number came from.
Part 3: Three Questions to Ask
You will probably not fix most of this yourself. You will ask the team that can.
Most Data Failures Are Not Technical
The tracker is not broken because of bad code. It is broken because no one owns it, no one knows when it last updated, and no one checks it against anything.
That is governance, and governance is a management problem before it is an engineering one. You do not need to write the pipeline. You need to know what to ask the person who did.
The Three Questions
For any number your decision depends on:
- Who owns this? One name. If the answer is “the team” or a shrug, that is your single source of truth problem and your bus factor problem in one sentence.
- When did it last refresh? A figure nobody has touched since Tuesday is a different risk than a live one. Stale beats wrong, but only if you know which you are holding.
- What is it reconciled against? If the answer is “nothing,” you are back to the tracker versus the system. Every number you can trust is checked against something.
Why These Three
Each question is a pitfall turned into a habit.
| Question | The pitfall it catches |
|---|---|
| Who owns this? | No single source of truth, bus factor |
| When did it last refresh? | Silent staleness |
| What is it reconciled against? | No lineage, duplicates |
Three questions, asked out loud in a meeting, will save you more bad decisions than any dashboard.
🧠 Quick Quiz: Where to Start
Your team wants a new dashboard. What should you do first?
A. Inventory every data source you currently have access to and map what is in them.
B. Ask IT which tables are already modeled so you can reuse existing work.
C. Write down the decision the dashboard is supposed to change.
D. Pick the visualization tool the company already licenses.
C. Start with the business question, specifically the decision that hangs on it. Starting from the data you happen to have is how you end up with a beautiful dashboard full of vanity metrics that nobody acts on. A and B are the second question. D is barely a question at all.
What We Just Did
You now have language for a thing you already knew was broken.
| Symptom you have lived | What to call it |
|---|---|
| “Our numbers do not match theirs” | No single source of truth |
| “Half the accounts fell out of the report” | Key drift |
| “It sorted wrong” / “the dates are backwards” | Format chaos |
| “Revenue looks too high” | Duplicates |
| “Where did this number come from?” | No lineage |
| “Only Dave knows how to run it” | Bus factor |
The left column gets you sympathy. The right column gets you a fix.
The Big Ideas
- Two numbers for one question is not a data problem. It is an ownership problem wearing a data costume.
- Broken matchs fail silently. They do not error, they just quietly return less. Duplicates fail loudly the other way, and the two can cancel out.
- Lineage is the first ask, not the last. “Where did this come from” beats “can you re-run it.”
- Governance is three questions. Who owns it, when did it refresh, what is it checked against.
- Name the pitfall, not the feeling. “The CRM has no key on 5% of rows” gets engineering help. “The data is a mess” gets you a shrug.
Up Next
Next you put this to work. You will take one report you actually own and run it through the same questions, in writing, with the group.
2. Making it Personal
Making it Personal
The pitfalls are generic. Yours are specific.
Think-Pair-Share: Pitfalls
- The provided handout walks you through evaluating how some of these questions or pitfalls apply to a report or dashboard you are responsible for.
- Take 5 minutes to fill out the first two sections: identifying a report you want to analyze and thinking through what pitfalls might be applying
- Then we’ll take 5 minutes to share out between partners
Think-Pair-Share: Lineage
- Building on the previous pitfall of lineage, it is vital to understand and break up all the discrete transformations or data movement that take place between an original data source and the final report or table
- Take another 5 minutes to break this down for your report or dashboard. What major steps does the data go through before it reaches its final destination?
- Then we’ll take another 5 minutes to share between partners. Have they caught and listed all the pertinent steps?
Think-Pair-Share: Health Checks
- Each step of the way, from data source to final destination, it is important to work through what is happening, who owns that process, and what checks are being done on data quality
- For each step in your listed lineage, go through the health checklist in the worksheet, filling out each of the 5 sections
- We’ll take 5-10 minutes for you to work through these independently, then give you some time to share your major findings or points of concern with a partner
Process Debriefing
- What are your main take-aways from this activity?
- This was the work necessary to evaluate a single report or dashboard. How does this scale to multiple reports or dashboards?
BREAK TIME!
3. Big Picture Data Pipelines
Big Picture Data Pipelines
The thing that breaks, and what it is actually made of.
What even is a Data Pipeline?
- Given the potential pitfalls, a good data pipeline is built to combat or insulate our data from these effects
- A clear, clean, source of truth with well determined lineage
- To maintain this, most tasks are usually automated
- The idea is to take data in a raw form and move it through the pipeline into a state where downstream users can easily use it to answer business questions
- As such, a pipeline:
- Ingests information from various sources
- Cleans it up/standardizes it, and combines it
- Organizes for relevant business decisions
Mission Objective #1
- Zoomed out, creating, modifying, and managing company-wide data pipelines is likely outside your responsibilities
- Nonetheless, you likely have data or want access to data flowing through those pipelines
- May also have your own data desires or needs to communicate to the IT or data team
- So understanding a bit of the overall architecture and vocabulary used for these large-scale pipelines can be useful for communication
ETL and ELT
- The letters E, T, and L stand for:
- Extract: pulling the data that you want to work with
- Transform: cleaning up and standardizing that data
- Load: moving that data into a single source of truth database, commonly called a warehouse
- Historically, ETL was also the common ordering for doing these operations, with cleaning and standardizing happening before loading to the warehouse
- More recently, the pattern has largely shifted to ELT: first loading the raw data into the warehouse, and then cleaning and transforming it there
- Largely driven by easily accessible (and scalable) compute in cloud warehouses
Modern Pipelines
Movement Timings
- Each arrow in the previous diagrams represents a movement of data
- How often should data be moved through the pipeline?
- Batch loading transports entire blocks of information through the pipeline together.
- Run on some interval, e.g. hourly or daily
- Dashboards or reports do not get updated until the end of each interval
- Stream loading transports individual pieces of information through the pipeline as they arrive or are generated
- Depending on data throughput, generally more computationally expensive, and aggregates can be trickier
- Dashboards and reports are as close to live as they can be
- Batch loading transports entire blocks of information through the pipeline together.
A Question of Schema
- Databases, unlike spreadsheets, maintain a strict schema, on a per-table basis
- Each column can generally hold only a single type of data
- All columns must contain the same number of rows
- Pros:
- Downstream consumers of the data know what to expect
- Helps eliminate egregious data cleanliness issues
- Cons:
- Data sometimes changes form, requiring schema migrations
- Can be inflexible if a piece of information can take on multiple forms
Some Quick Shopping
- Data Warehouses are terrific for serving as a single source-of-truth for an entire company or division, but can be unwieldy or potentially face governance issues of who is allowed to see what information
- A data mart is a small slice of the data warehouse, potentially lightly customized for use by a specific team
- Populated after the warehouse has been updated
- Gives smaller teams a coherent and manageable source-of-truth for their specific requirements and needs

Interacting with a Database
- So, IT has granted you and your team access to a data mart customized for your needs. How do you use it?
- For relational databases, the primary way of interacting with the database is through the scripting language SQL
- SQL is a declarative language, so it reads more like plain-English than many scripting languages, but can still have a lot of special keywords to understand
- Keywords in SQL are followed by extra information that provides context or details to the keyword
- The keywords are not doing anything magical! Mostly just similar operations to what you might do in a spreadsheet program like Excel
Mission Objective #2
- While you likely don’t need to often write or generate SQL yourself, you may need to view or verify written SQL from time to time
- As such, it is useful to understand how to parse different SQL queries in a context that you better understand: Excel
- So let’s unpack some Excel analogs to SQL keywords, and see how they’d appear in a query
ExSQL?
| SQL Keyword | Description | Excel Equivalent |
|---|---|---|
SELECT |
Chooses the columns to show | Hiding columns or choosing table fields |
FROM |
Tell the database what table to look in | Selecting a tab name |
WHERE |
Filters the rows based on specific conditions | Clicking the drop-down filter on a column header |
JOIN |
Merging tables together using a matching ID | Running a VLOOKUP or XLOOKUP |
GROUP BY |
Collecting and collapsing similar values to summarize | Creating a pivot table |
ORDER BY |
Ordering the rows by a particular column | Sorting a table by a column |
AS |
Rename a column or table | Renaming a column |
Unpacking a Query
Suppose we then have the following query. What might its equivalent actions be in Excel?
- 1
-
Pull data from the
branchestable - 2
- Only keep rows that have Northeast as the region
- 3
- Make a pivot table where each row will be a state
- 4
-
Compute the average
sq_ftof all branch buildings across each state and rename toavg_ft - 5
- Order rows by decreasing size, so largest at top
SQL Ordering
- You may notice that the top-down ordering of an SQL query is unfortunately not really the order you would undertake those actions
- Main SQL keywords “execute” in the order of:
FROM→JOIN→WHERE→GROUP BY→SELECT→ORDER BY - The most fundamental thing to understand here is that rows are filtered before any sorts of aggregates are computed
Your Turn
- Yesterday, you were introduced to the Dunder-Mifflin simulated data set.
- For this exercise, you’ll want to open the
employees.csvandbranches.csvinto their own tabs in Excel - Can you compute the same results as the following SQL queries but in Excel?
SQL 1
| branch_name | salary |
|---|---|
| Corporate HQ | 168000 |
| Rochester | 63146 |
| Albany | 50186 |
| Buffalo | 65147 |
| Utica | 63639 |
| Yonkers | 61574 |
SQL 2
| department | dept_avg_sal |
|---|---|
| Sales | 58957.4565 |
| Warehouse | 48910.5 |
| Accounting | 61051.1282 |
| Corporate | 251250.0 |
| Human Resources | 61463.5540 |
| Management | 85333.3333 |
Big To Small
- While full, large-scale pipelines tend to use SQL and perhaps a bit of Python to shepherd data from location to location, that doesn’t have to be the only example of a data pipeline
- We can also shrink things down to more local pipelines where we want the same sorts of effects:
- A clear source of truth
- Systematic and consistent cleaning and formatting conventions
- A clear data lineage that showcases exactly where each piece of information comes from
- Going forward, we’ll play around with some tools that you already have at your disposal that may assist with this smaller, local pipelines
4. Building Mini-pipelines
Learning Objectives
What You’ll Leave With
By the end of this segment, you will be able to:
- Explain what Power Query is and what problem it solves.
- Build a mini-pipeline that combines a folder of weekly files and cleans them.
- Add a new file to that pipeline without editing anything, by clicking Refresh.
- Say why a recorded pipeline beats asking an AI to clean the file each week.
Get the Data
We have been using a paper company all workshop. For this next part, the data is yours-ish.
Download the updated files for this segment from Canvas → Modules → mini-pipeline.zip
Inside you get two folders. We start in weekly-service.
| Folder | What’s in it |
|---|---|
weekly-service |
Three site files. This is the folder you point Excel at. |
late-arrival |
One more file. Do not touch it yet. |
Reality Check
Spreadsheets run a lot of the business. They will keep running it for now.
Not because they are the best tool. Because operations do not wait for a perfect warehouse, unlimited compute, aligned teams, or politics to settle.
Until those constraints go away, Excel is where the work happens. Power Query is how you make that work repeatable.
Part 1: What Power Query Actually Is
It has been sitting in the Data ribbon this whole time.
The Definition
Power Query is a tool built into Excel that records the steps you take to clean and combine data, then replays them on demand.
That is the whole idea. It is not a better way to clean a file once.
It is a way to clean a file the same way every time.
It Is Already There
Excel: the Data ribbon → Get Data.
No install, no license, no ticket to IT. If you have Excel, you have it.
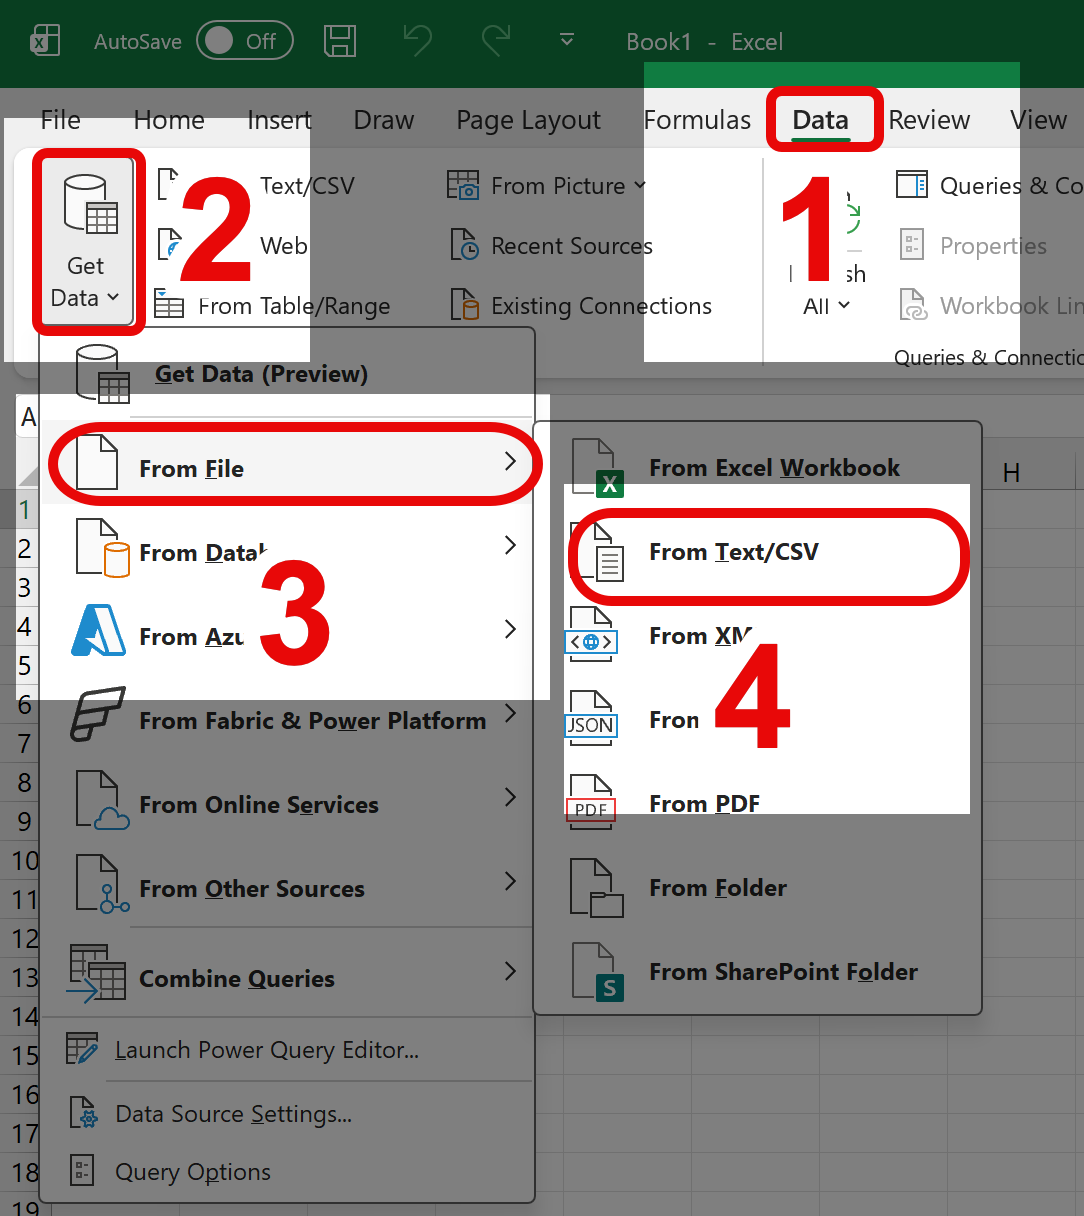
Excel’s Power Query
Excel Speaks ETL (Extract, Transform, Load)?
Yes! And it’s called Power Query
Same three letters, with a mouse attached.
Why You Should Care: What Comes After
Your cleaned table is almost never the finish line. It is the input to something else.
Every one of those inherits whatever you hand it. A model trained on a column that was text last week and numbers this week is confidently wrong, and it will not tell you.
Data Integrity Is the Product
This is why we are spending forty-five minutes on a spreadsheet feature.
The pipeline is not the point. The point is that the shape of your data stops changing without warning.
Same columns, same types, same cleaning, every week. That is what makes everything downstream trustworthy.
Part 2: But Couldn’t AI Just Do This?
Fair question. Let’s take it seriously.
Yes, It Can
Paste a messy file into a chat assistant and ask it to clean up the amounts and fix the names, and it will do a genuinely good job.
Generative AI is excellent at figuring out what transformation you need. Use it for that.
But It Is Non-Deterministic
A language model does not execute your instructions. It predicts the next token, sampling from a probability distribution over the possibilities.
Practically, that means the same file and the same prompt can give you a different answer on a different run.
What That Looks Like In Practice
Run the same cleanup twice and you might get:
- A column named
Engineerone time andEngineer Namethe next. 03/04/2026read as March 4th once and April 3rd the next.- A total that is off by the eleven rows it quietly skipped.
- No record of which version you actually pasted into the board deck.
None of those are bugs. That is the technology working as designed.
Deterministic Means Boring, and Boring Is What You Want
Ask AI each week
Same input, possibly different output.
No record of what it did.
Recorded pipeline ⭐
Same input, same output. Every time.
Every step written down, in order.
Use AI to work out the transformation. Use a recorded pipeline to run it.
🧠 Quick Quiz: Why Not Just Ask AI Weekly?
Your weekly revenue number feeds a forecast the VP sees. Why is a recorded Power Query pipeline the better tool than pasting the file into an AI assistant each Monday?
A. AI cannot read CSV files.
B. It is deterministic: the same input produces the same output, and the steps are recorded.
C. Power Query is faster than AI.
D. Company policy forbids AI for all data work.
B. AI is genuinely good at working out what to do. It is a poor fit for the part that has to happen identically every week and be auditable afterward. A is false, C is not reliably true, and D is not the reason.
To Be Clear, This Is Not An Argument Against AI
None of this says keep AI out of your work. It says pick the right job for it.
This particular job, the same cleanup every Monday feeding a number someone acts on, wants a boring, repeatable process.
Next time we are together, when we can get at your actual AI toolchain, we can look at where it genuinely fits in your workflows.
😃
Part 3: The Weekly Problem
Now the actual scenario. This one might be yours.
Every Monday, The Same Chore
You own field service for a region. Every Monday, three service sites send you their weekly tool log: every PM, every unscheduled down, every parts replacement on the installed base.
Same columns, same shape, three separate files. You open each one, fix the same things every time, and paste it all into a master sheet before the ops review.
It takes twenty minutes. Every week. Forever. And next Monday there will be three more.
The Files
| File | Rows |
|---|---|
service_hillsboro_2026-03-02.xlsx |
74 |
service_chandler_2026-03-02.xlsx |
61 |
service_austin_2026-03-02.xlsx |
68 |
203 rows across the three. Etch, deposition, and clean tools, one week.
What Is In Them
| Column | Example |
|---|---|
Service Date |
2026-03-04 |
Site |
Hillsboro |
Tool ID |
Kiyo-4412 |
Process Step |
Conductor Etch |
Event Type |
Unscheduled Down |
Downtime Hours |
14.2 hrs |
Engineer |
Dana Whitfield |
Parts Cost |
USD 12,480.00 |
Only Two Kinds of Problem
Every file has exactly the same problems. That is realistic: the same system exports the same way every week.
1. Numbers that are not numbers
USD 12,480.00
14.2 hrs
The USD and the hrs make Excel treat both as words. SUM returns 0.
2. Names that are not consistent
Dana Whitfield
marcus chen
PRIYA RAMAN
Stray spaces and random casing. Three spellings of one engineer.
Strip the words off the numbers, tidy the names, and the data is good. That is the whole cleanup.
The One Trick That Matters
Do not load three files. Point Excel at the folder.
Get Data → From File → From Folder
Power Query reads every file in that folder and stacks them into one table. Three sites today. Four next week. You do not have to care.
Because these are workbooks, it will ask which object to pull out of each one. Pick the table called ServiceLog, not Sheet1. Then OK.
Watch First, Then Build
I am going to do Parts 1 and 2 off your worksheet: combine the folder, then strip the words off Parts Cost.
Watch the Applied Steps pane on the right. That is the whole idea.
Then you do those same two parts yourself and keep going through Part 6.
What You Just Saw
Every click I made became a line in Applied Steps.
- I never edited the original workbook. It is untouched on disk.
- I can click any step and see the data as it looked at that moment.
- I can delete a step I got wrong.
- Those steps are the pipeline. They will run again on any file I point them at.
Part 4: Build It
Ten minutes. Your turn.
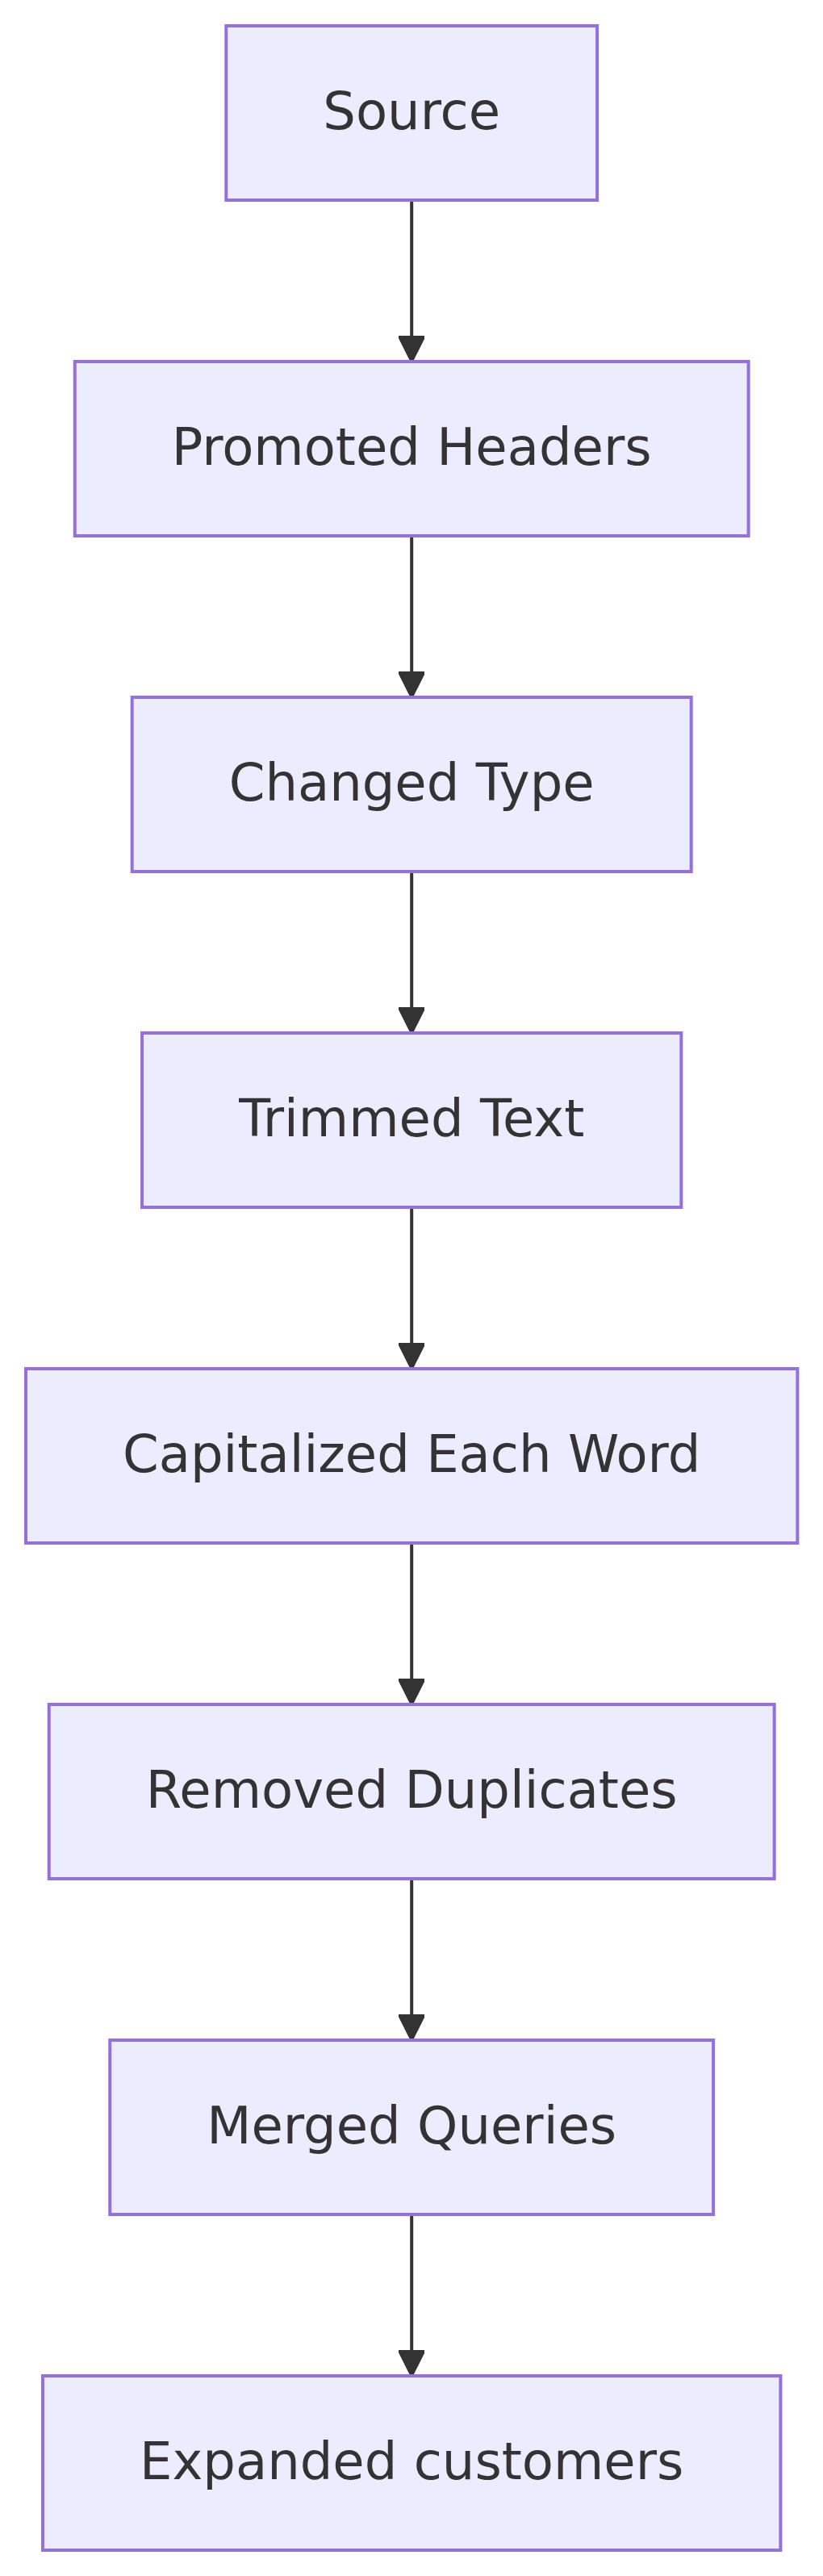
The Whole Activity, One Picture
Start at Part 1 and redo what you just watched. Keep going to Part 6. Click-by-click detail is on the page in front of you.
Blue is what you just watched me do. Grey is new.
When you are done: 203 rows, Parts Cost totals $1,707,171.19, Downtime totals 1,331.6 hours.
Stuck?
That is fine. Three things go wrong, and all three have the same fix.
- Seeing a column called
Contentfull of the wordBinary? You clickedLoadinstead ofCombine & Transform Data. Delete the query and start again. - Only seeing one site? You picked a file instead of the folder. Go back one step.
- Columns named
Column1,Column2, and the header words showing up as data? In the Combine dialog you pickedSheet1instead ofServiceLog. Delete the query and start again. - Grab me or anyone on the teaching team. Do not sit stuck and quiet.
Part 5: The Payoff
This is the part worth remembering.
It Is 1:40 PM. Your Meeting Is At 2:00.
Villach just sent theirs. They… were late.
The downtime number in your deck is now wrong. You have twenty minutes.
What do you have to change in your pipeline?
Nothing.
That is the entire procedure. Now you do it.
Your Turn: Worksheet Part 7
Two minutes. Do not rebuild anything.
- In File Explorer, drag
service_villach_2026-03-02.xlsxout oflate-arrivaland into theweekly-servicefolder. - Back in Excel:
Data→Refresh All. - Write the new row count and both totals in Part 7 of your worksheet.
Check Your Numbers
Before
203 rows
$1,707,171.19
1,331.6 downtime hours
After Refresh ⭐
260 rows
$2,189,681.59
1,710.5 downtime hours
Villach’s 57 rows came in with every step you built already applied. You never opened their file.
That Is the Whole Point
You did not edit a formula. You did not redo the cleaning. You did not remember what you did last week.
You added a file and clicked Refresh.
Next Monday, when three more files land, it is the same two moves. That is a pipeline.
Part 6: Where This Leaves You
Vocabulary, limits, and what to do Monday.
Applied Steps Is Your Lineage
In the first segment we said lineage is the map of a number’s journey, and that without it you have folklore.
Applied Steps is that map, written down as you work, for free.
Anyone can open your query and read exactly what happened to that number, in order.
The Word for What You Did
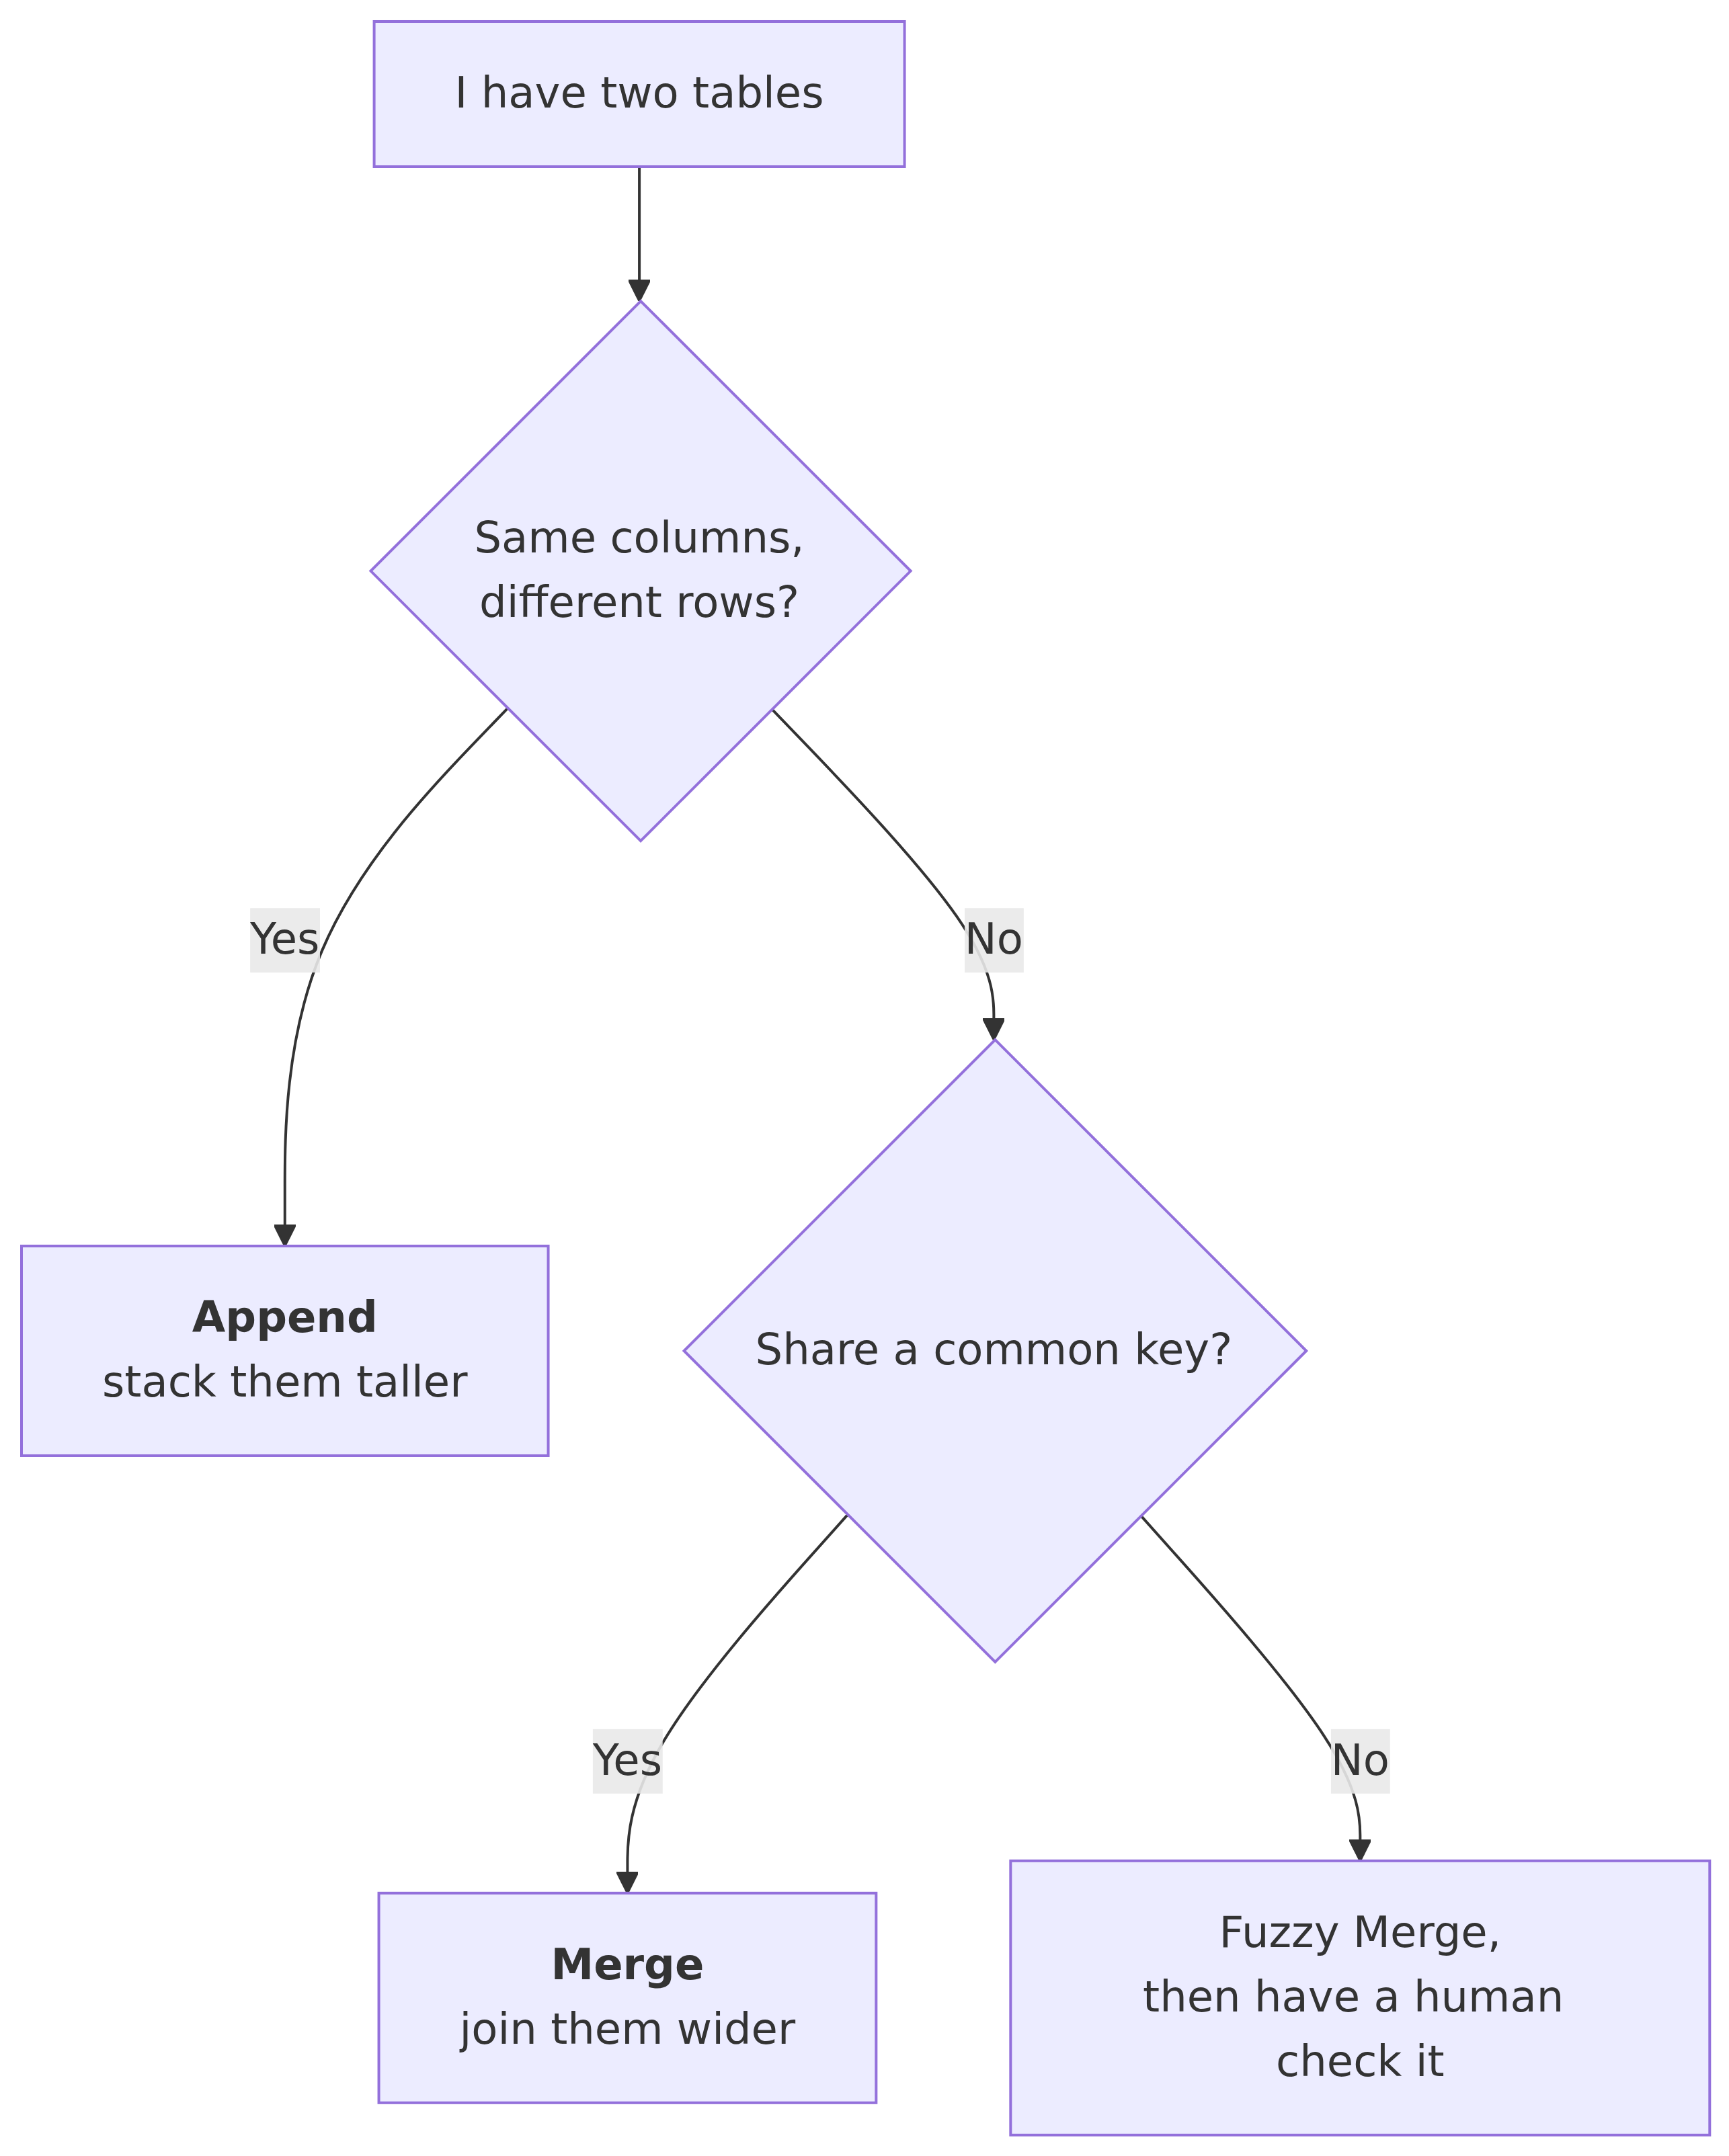
You appended: stacking files with the same columns to make the table taller.
The other one is merge: matching two different tables on a shared key to make the table wider. That is Excel’s VLOOKUP, and SQL’s JOIN.
Say the right word and your data team knows what you need in about four seconds.
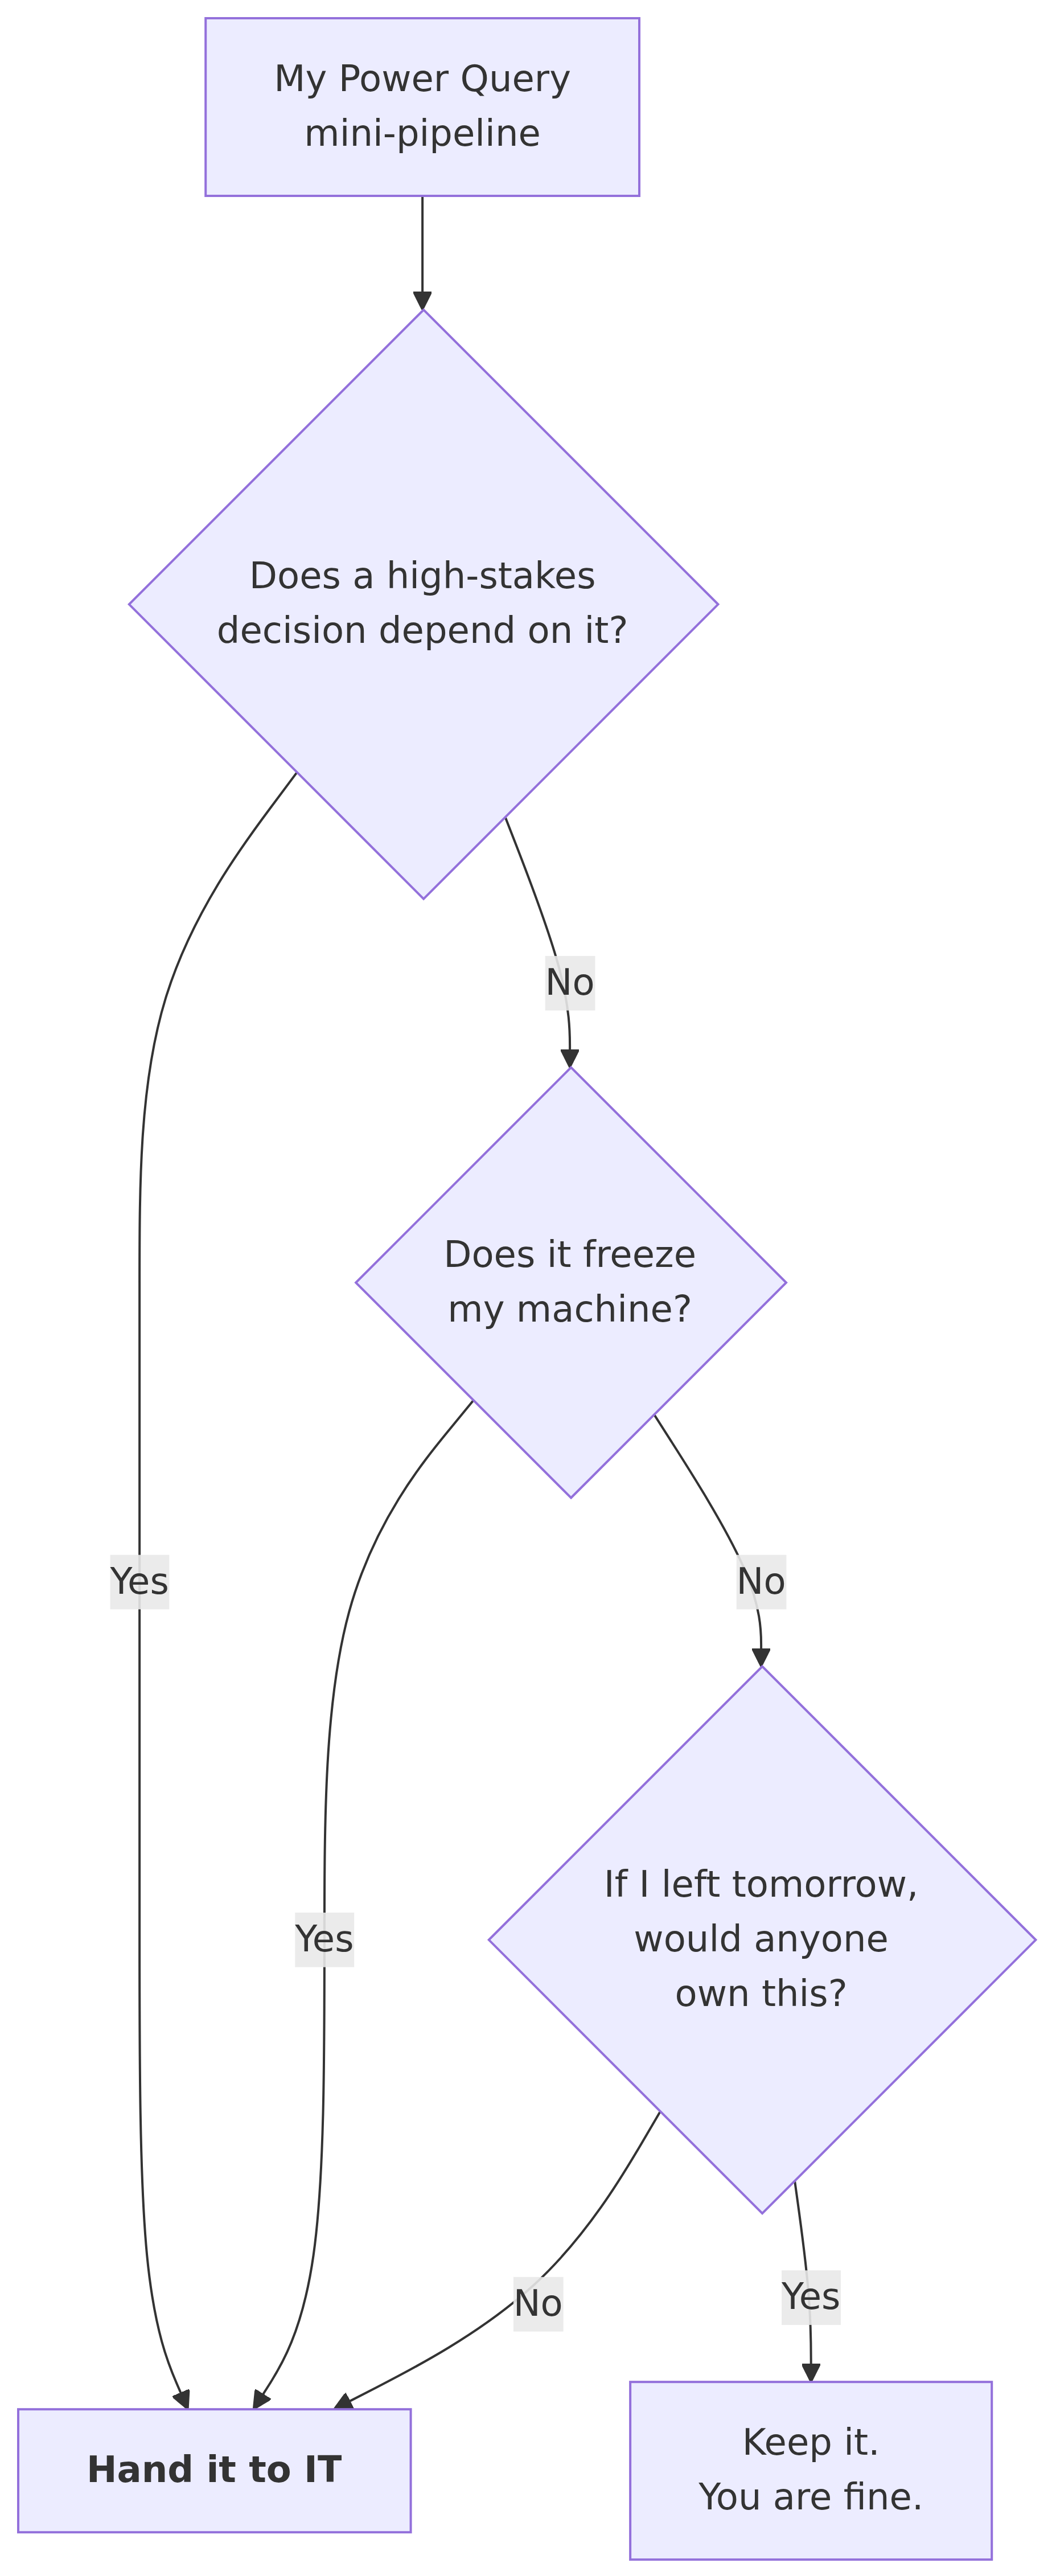
When Does This Stop Being Yours?
Hand it to IT when any one of these is true:
- Stakes. A high-consequence decision depends on it.
- Volume. It has grown big enough to freeze your laptop.
- Ownership. If you left tomorrow, nobody could run it.
Not because a file got big. Not because of a memo. Because of consequence.
The Big Ideas
- Power Query records what you do and replays it. That is the entire product.
- Point at the folder, not the file. New files join the pipeline for free.
- AI figures out the transformation. A pipeline runs it. Non-deterministic tools do not belong in a step that has to be identical every week.
- Clean input is the deliverable. Dashboards, forecasts, and models all inherit whatever you hand them.
- Two clicks beat twenty minutes, and they beat your memory of what you did last week.
Try This Monday
Pick the most annoying recurring file you deal with.
- Put it in a folder of its own.
- Build the pipeline once, with however many steps it needs.
- Next time that file arrives, drop it in and hit Refresh.
If it works, you just bought back that twenty minutes for the rest of the year.
5. References and Resources
References and Resources
- Dunder Mifflin Paper Company dataset. https://dataengineering.education/files/workshop_data.zip
- Wickham, H. (2014). “Tidy Data.” Journal of Statistical Software 59(10). The tidy rules from Session 1, and what messy data looks like.
- Kimball, R. and Ross, M. The Data Warehouse Toolkit, 3rd ed. Wiley, 2013. Chapter 1, on why a single source of truth is a design decision rather than an accident.
- Microsoft. “Data lineage in Microsoft Purview.” https://learn.microsoft.com/en-us/purview/concept-data-lineage
- Microsoft. “Power Query documentation.” https://learn.microsoft.com/en-us/power-query/
- Microsoft. “Merge queries overview.” https://learn.microsoft.com/en-us/power-query/merge-queries-overview
- Microsoft. “Fuzzy merge.” https://learn.microsoft.com/en-us/power-query/fuzzy-matching
- Microsoft. “Import data from a folder with multiple files.” https://learn.microsoft.com/en-us/power-query/connectors/folder